Financial counseling and benchmarking tools can provide valuable insights for farmers aiming to improve their operations. One way we do that at Compeer Financial is with our Financial Peer Report – a personalized financial report that also includes peer group information, helping clients benchmark themselves against others in their industry. We also include a “Best in Class” category, highlighting the top 25% of peers with the highest net earnings per acre. Here, we focus on the financial metrics that set this “Best in Class” group apart.
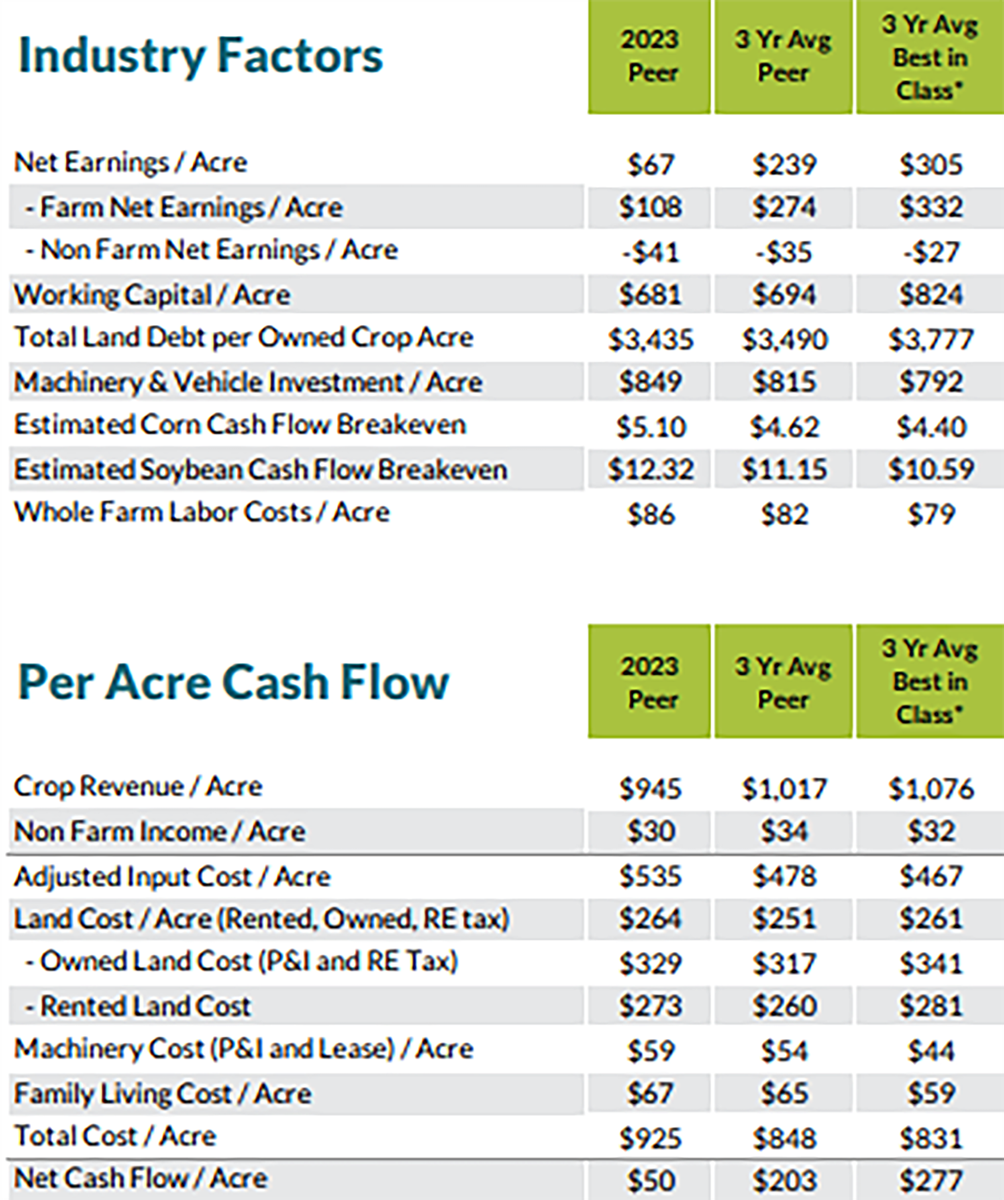
How does the “Best in Class” compare to the peer group? On a three-year average (2021-2023), the “Best in Class” reported earnings of $305 per acre, compared to $239 per acre for the peer group – a difference of $66 per acre. That’s significant when compounded over an entire farming career.
One reason the “Best in Class” group earns more is by producing higher crop revenue per acre. On a three-year average, the “Best in Class” reported crop revenue per acre of $1,076, compared to the peer group’s $1,017 – a difference of $59 per acre. Most of the revenue difference is due to higher yields, with “Best in Class” producers reporting average yields of 217 bushels per acre (bu/ac) for corn and 64 bu/ac for soybeans, compared to 211 bu/ac for corn and 61 bu/ac for soybeans in the peer group.
You might assume higher yields would require higher production costs, but the data shows that the “Best in Class” actually has a slightly lower cost per acre than the peer group. The “Best in Class” reports total costs of $831 per acre, compared to the peer group’s $848 per acre. Broken down further, the “Best in Class” group reports higher land costs, with average rents at $281 per acre, compared to $260 per acre for the peer group. However, the “Best in Class” compensates for higher rent with lower input costs per acre (all expenses except land, equipment and family living expenses), as well as lower machinery and family living costs.
The higher yields and the lower cost per acre lead to a lower cost of production – $4.40 per bushel for corn and $10.59 per bushel for soybeans – compared to the peer group’s $4.62 and $11.15, respectively. Keeping production costs low is key to staying competitive long-term in the grain farming business.
What does the “Best in Class” group look like in other financial metrics?
- Working capital per acre: $824 per acre, which is $130 per acre more than the peer group. The “Best in Class” group generates more income and incurs lower family living costs.
- Land debt per acre: $3,777 per acre, which is $287 per acre higher than the peer group. The “Best in Class” can handle higher debt service due to their higher income.
- Operating expense ratio: 62%, which is 7% less than the peer group. This contributes to a higher net income ratio at 26%, or 7% above the peer group.
Exploring these metrics can help farmers identify strategies for boosting profitability, from lowering costs to improving yield. In a competitive agricultural environment, insights like these can provide guidance for those looking to achieve long-term financial health in their farming operations.

.png?ext=.png)
To learn more about how to financially benchmark your operation and see how your farm stacks up, reach out to your local Compeer financial officer.


