

Source: USDA
by Brian Williams, Matthew Miller, Erik Dohlman, Grace Grossen and Mildred Haley
Highlights
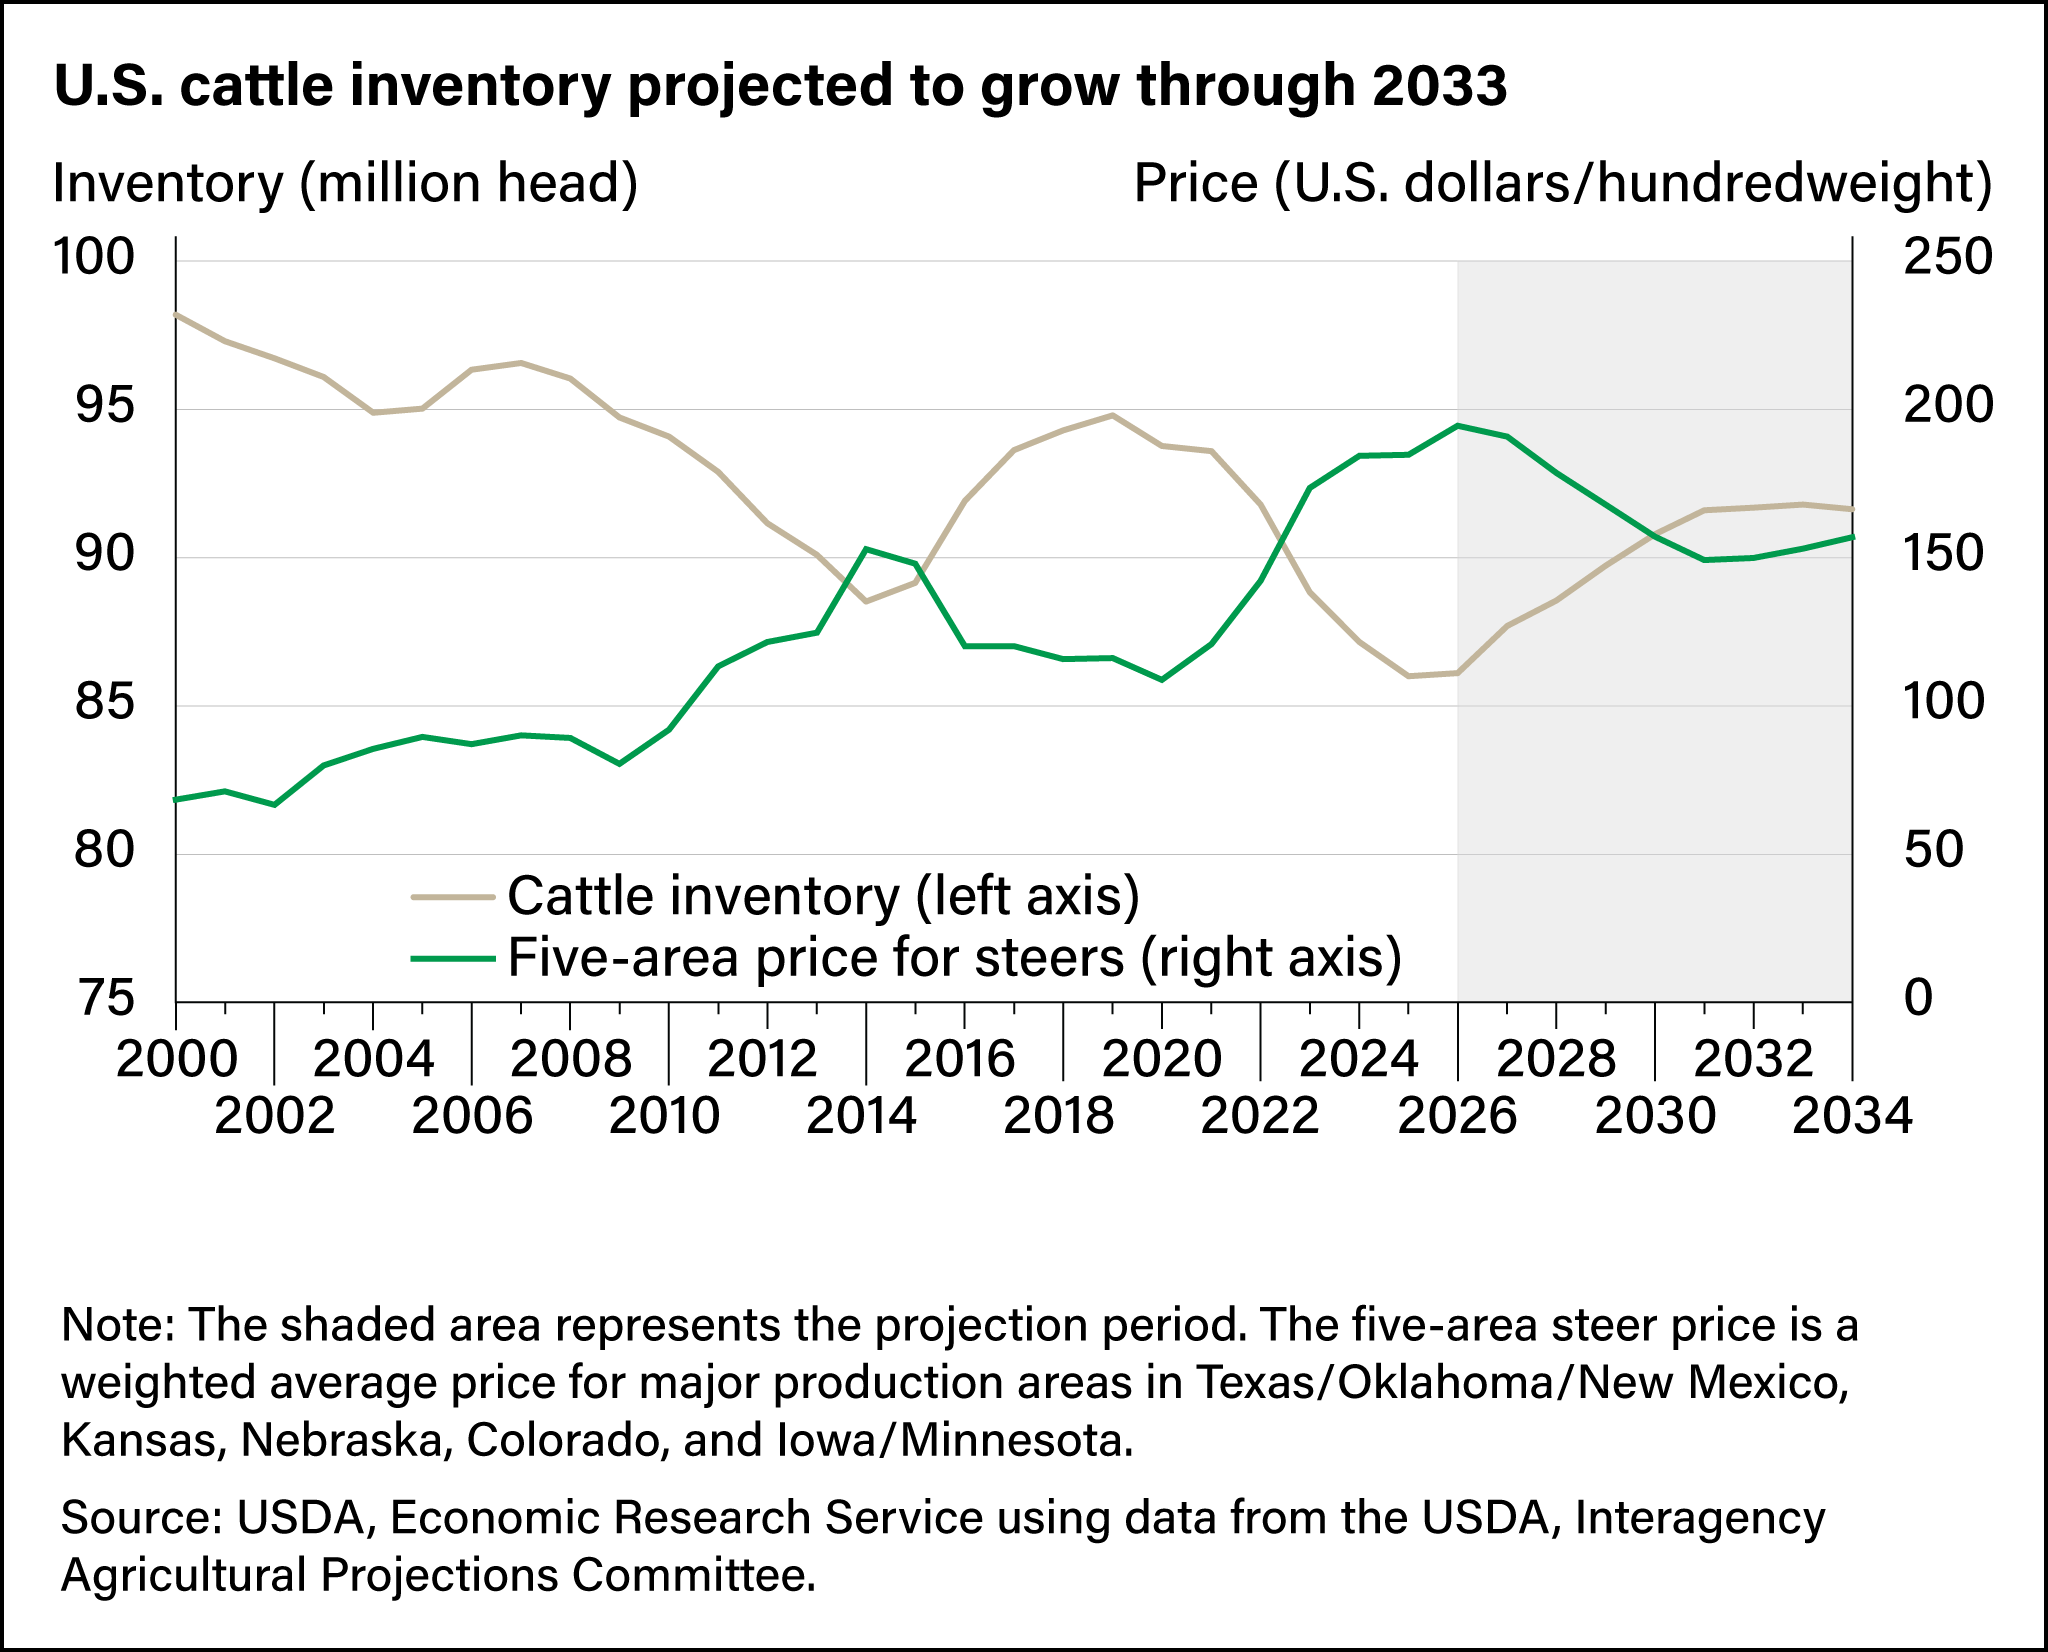
- After reaching a low point in the cattle cycle in 2025, U.S. cattle inventories are expected to rise to 91.6 million head in 2034. Low supplies in 2026 are projected to drive prices to a record high before falling back through 2031 and then starting a new climb through 2034.
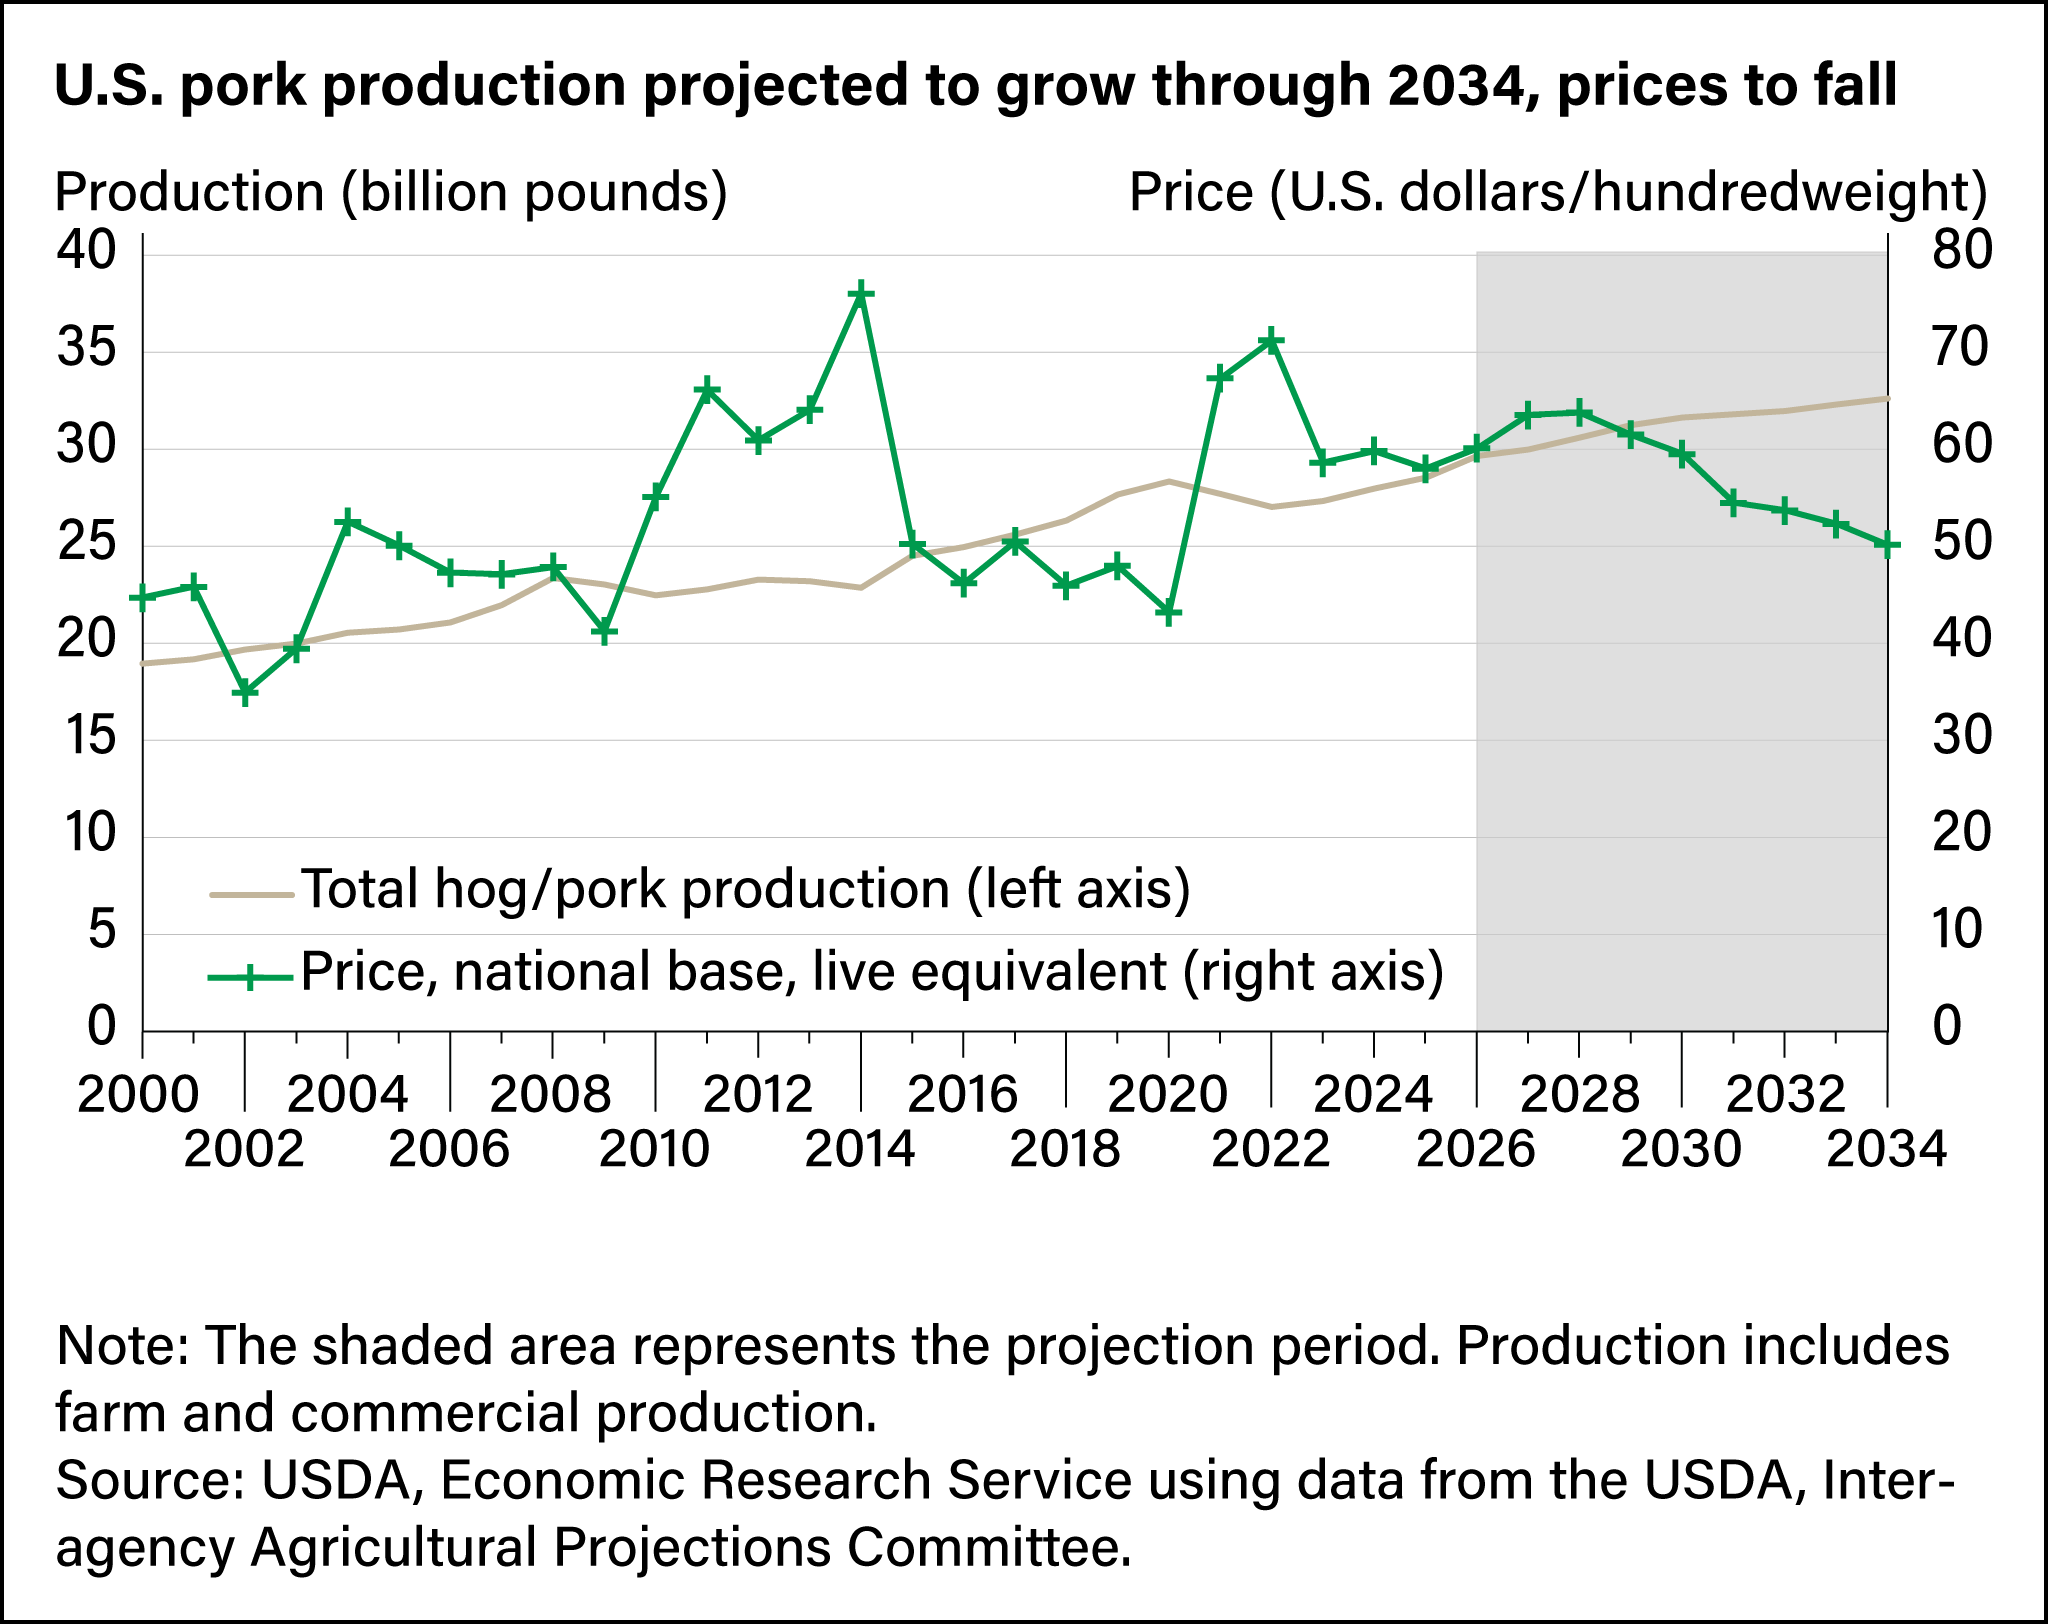
- Pork production is estimated to reach a record 32.6 million pounds in 2034 as per-capita domestic consumption climbs. Live hog prices are projected to rise through 2028 before starting a gradual decline.
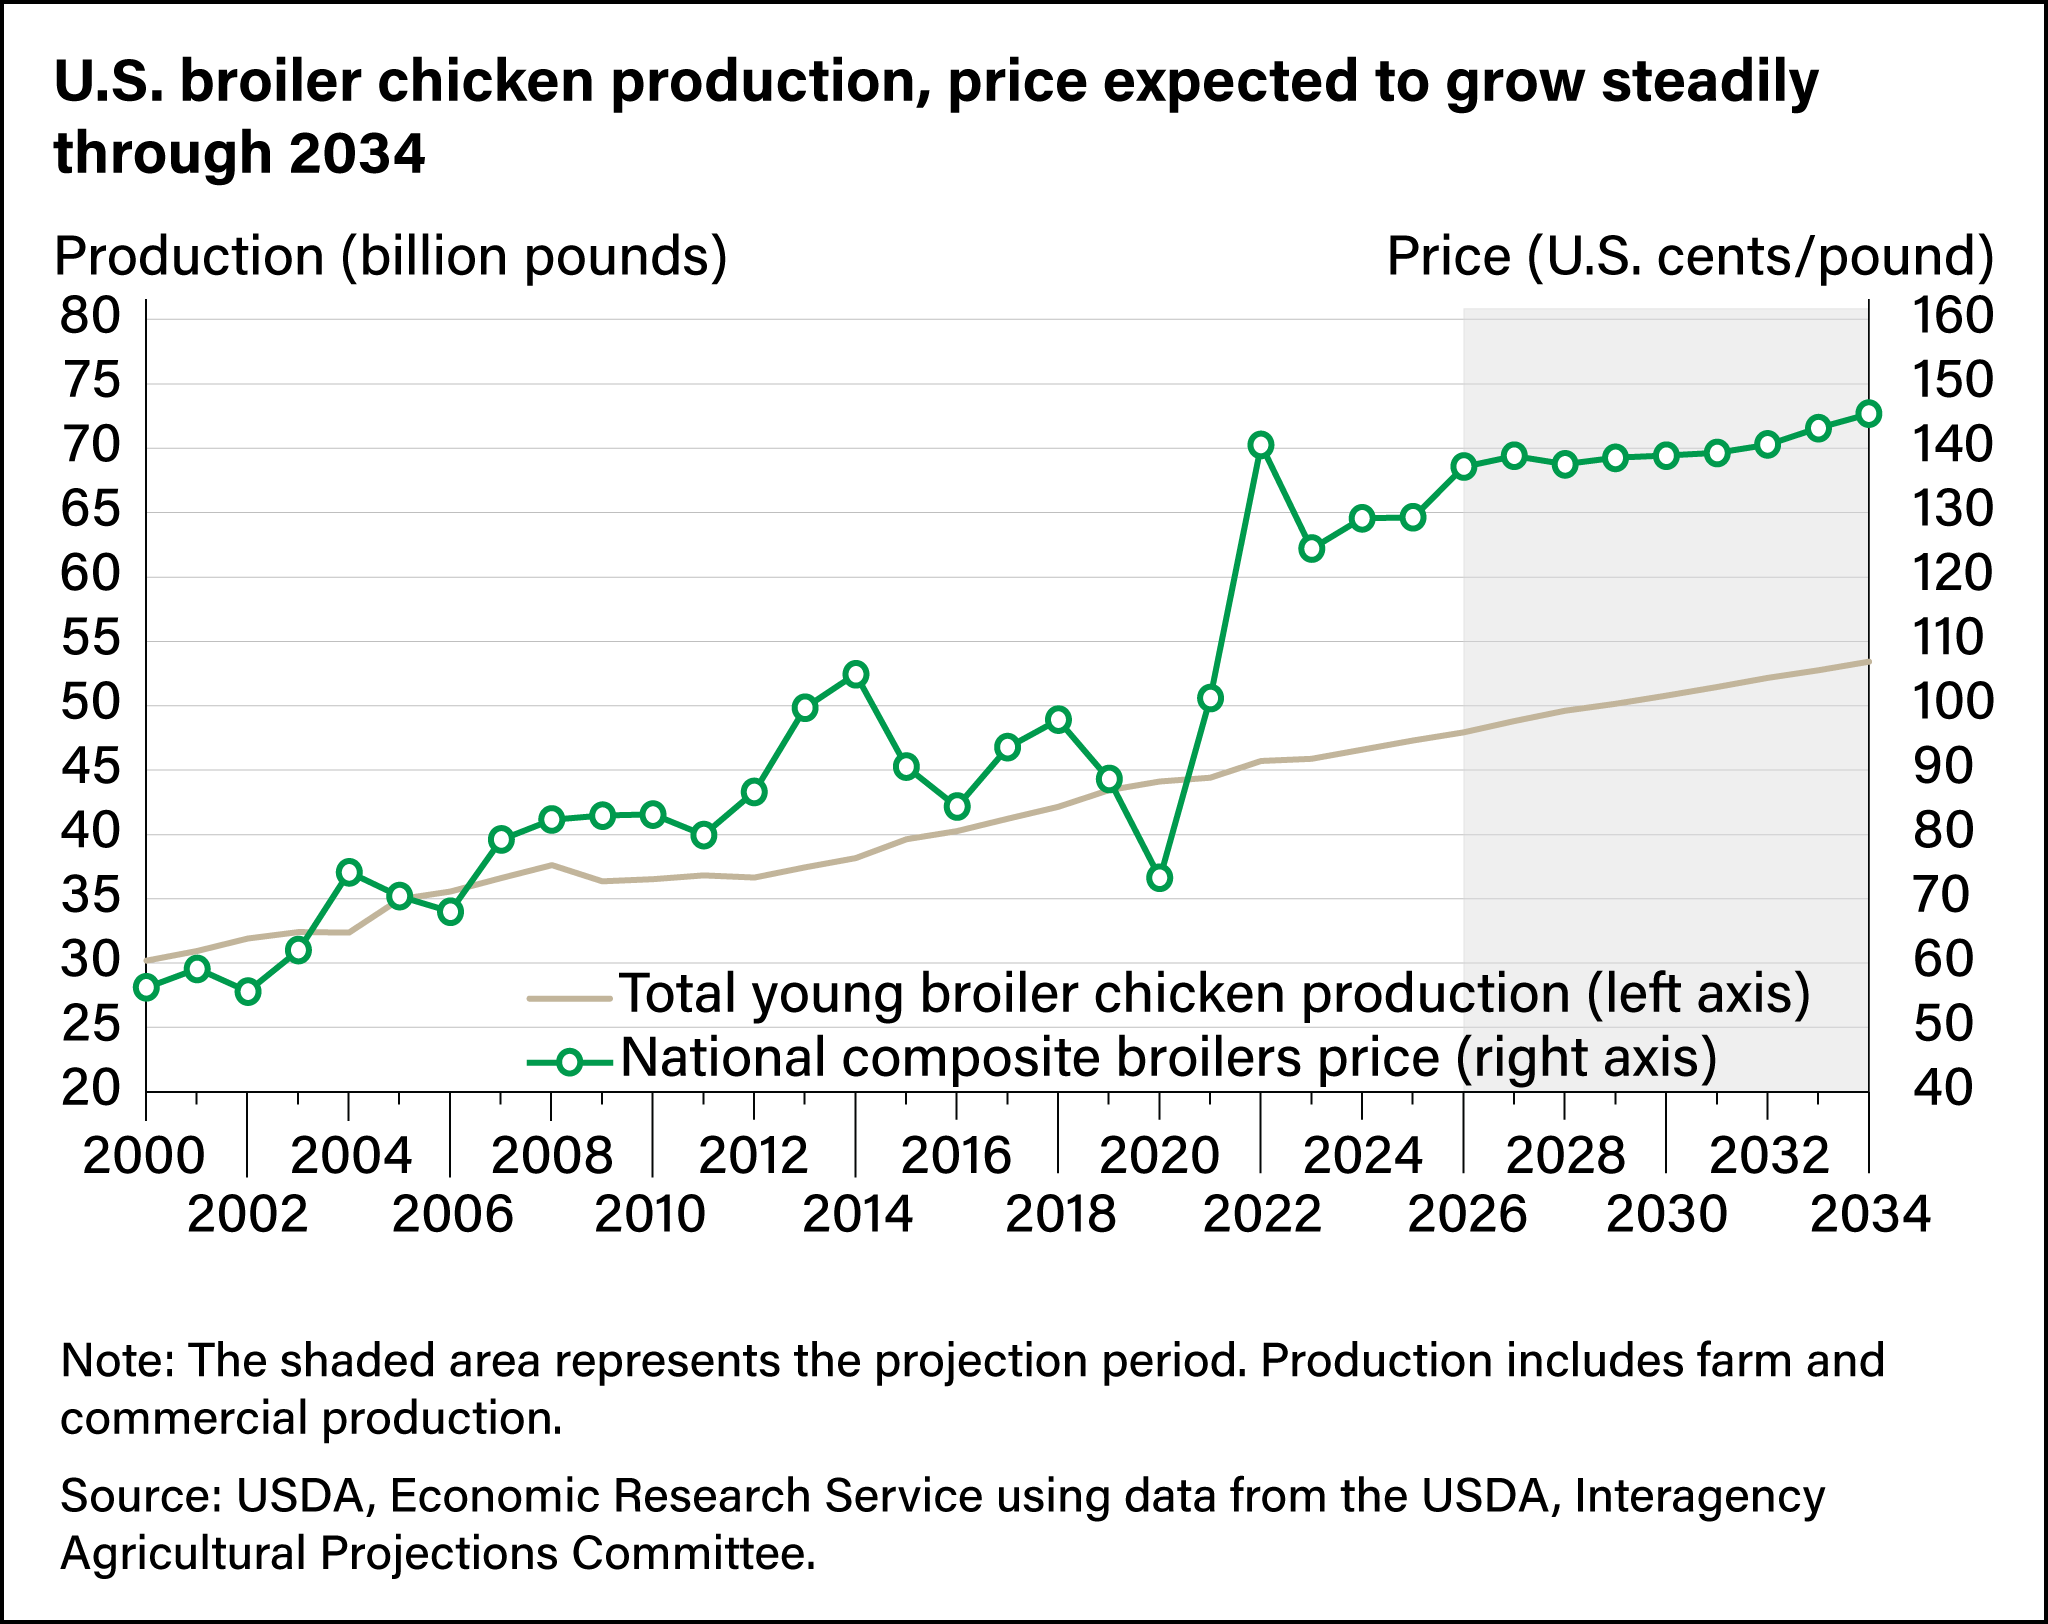
- Broiler chicken production is projected to reach successive annual record highs over the next 10 years driven by strengthening domestic demand and favorable margins between feed costs and output prices. Even with rising production, national composite broiler chicken prices are expected to climb slowly over the next 10 years.
In livestock production cycles, herd and flock sizes go through periods of expansion followed by periods of contraction. Market prices received by producers drive these cycles as producers decide whether to expand or sell their livestock based on the prices received for cattle, hogs, and chickens. Because the factors that determine prices and other production considerations—such as the time it takes an animal to mature—the cycles differ for each type of livestock. For instance, U.S. cattle inventories are projected to reach a multidecade low in 2025 after a recent peak in 2019. Record high beef cattle and feeder steer prices are projected in 2026 and high retail beef prices could continue for several years. At the same time, U.S. hog inventories and chicken production have expanded and are projected to continue doing so over the next 10 years. Hog prices are expected to increase through 2028 before declining through 2034, and chicken prices are expected mostly to increase steadily over the next decade. The cyclical nature in prices and production of each livestock species in turn can influence imports and exports of livestock products, with imports rising to meet demand during times of lower production and exports rising when there is a production surplus.
Cattle Prices Projected to Peak in 2026
Cattle numbers, cattle prices, and beef production tend to follow a cycle that lasts about 10 years but can range from 8 to 12 years depending on factors such as drought or feed costs. The cattle cycle is driven by cattle producers’ response to the markets. However, because of the nature of cattle production, it can take years for a producer to fully respond. For example, when higher market prices signal the time is right to expand herd sizes, cattle producers eventually respond by retaining (instead of raising for slaughter) female breeding calves. They do this despite the incentive to sell cattle while prices are high. The females that are retained will not produce a calf until 2 years of age, and that calf will take an additional 18 months to grow before it is ready for slaughter. This process of herd expansion continues until supplies rise to the point at which they pressure market prices lower, which triggers a reduction of cattle numbers and beef production. The response time from price changes to changing production is much faster for hogs/pork and—even more so—chickens because of biology. The reproductive cycle and development is measured in years for a bovine animal, in months for a hog, and in weeks for a chicken. U.S. cattle inventories are expected to reach a low point in the cattle cycle in 2025 with a total inventory of 86 million head, which would be the lowest cattle inventory since 1951. Inventories then are projected to climb through 2033, reaching a peak of 91.8 million head before declining slightly to 91.6 million head in 2034 to begin the next shift in the cattle cycle.
Cattle prices follow an inverse pattern relative to inventories. Low supplies in 2026 are projected to drive the five-area steer price (a weighted average price for major production areas in Texas/Oklahoma/New Mexico, Kansas, Nebraska, Colorado, and Iowa/Minnesota) to a record $196.49 per hundred pounds, or hundredweight, before falling to $150.65 by 2031. Prices are projected to then begin climbing, reaching $158.47 by 2034.
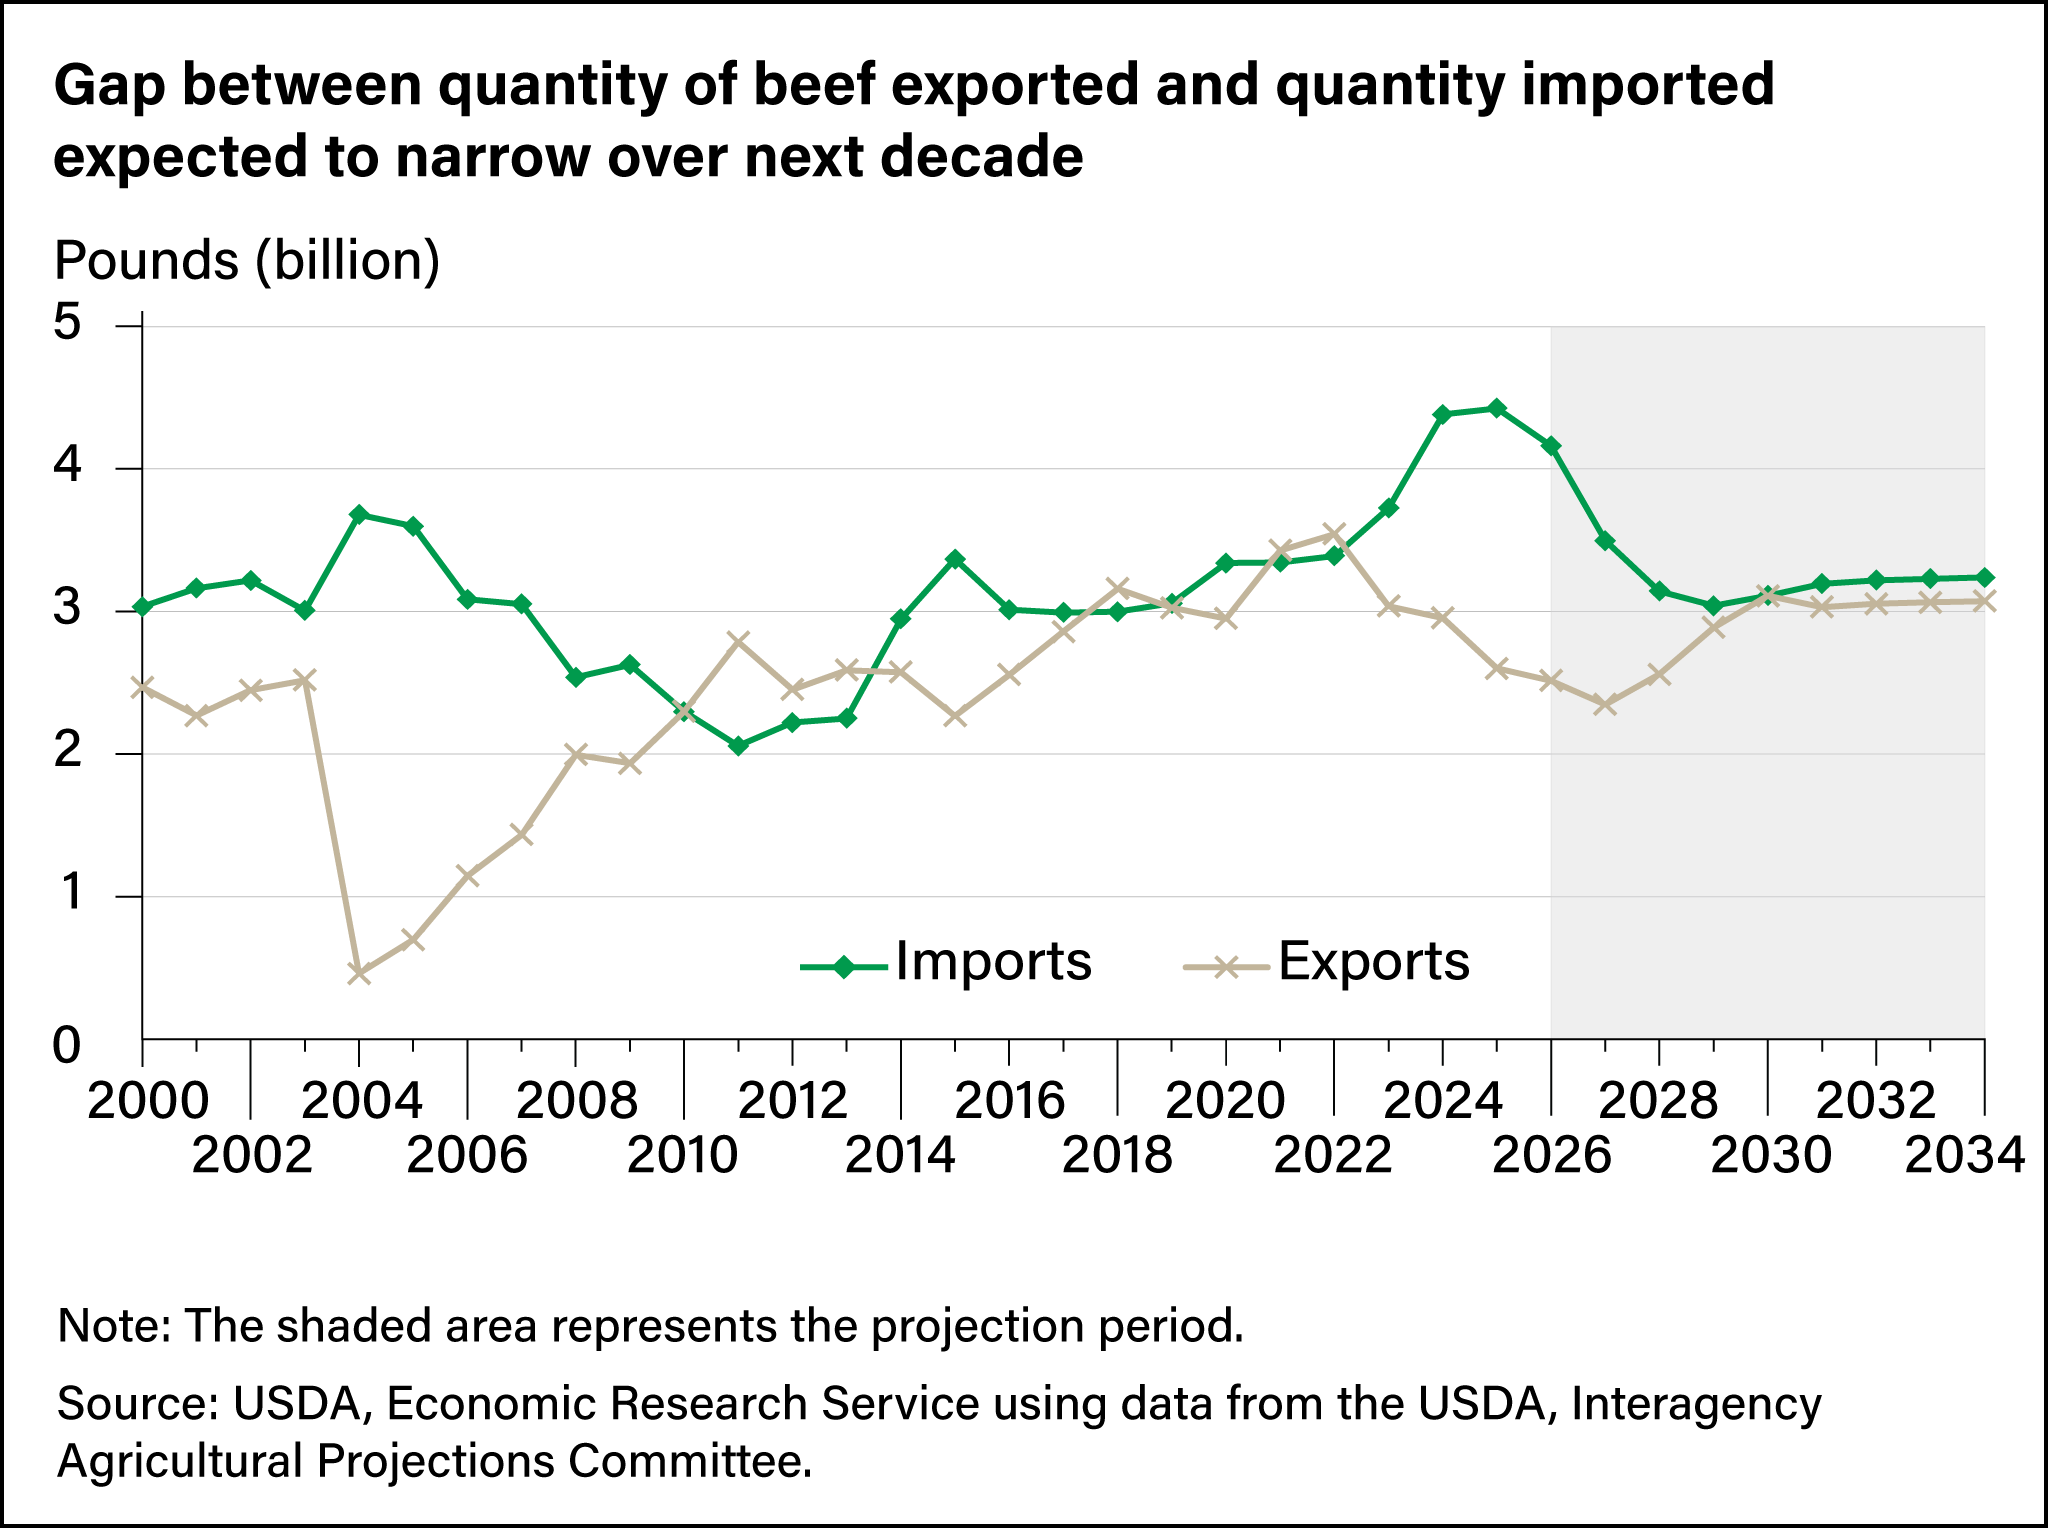
The low cattle inventories, a primary driver of total beef production, have influenced U.S. beef imports. Beef imports are expected to peak at a record 4.4 billion pounds in 2025 and decline through 2029 to 3.0 billion pounds as domestic production grows. During this time, slaughtered cattle weights are also expected to rise. Imports are projected to increase from 3.1 billion pounds in 2030 to 3.2 billion pounds by 2034. On the other side of trade, U.S. beef exports are projected to fall to a near-term low of 2.3 billion pounds in 2027, which would be the smallest since 2010, before climbing to 3.1 billion pounds in 2030 and leveling off through 2034. In effect, at low points of the production cycle, U.S. consumers outbid foreign consumers for foreign-produced beef, raising the volume of U.S. beef imports, while simultaneously decreasing U.S. beef exports by bidding prices higher for domestic consumption.
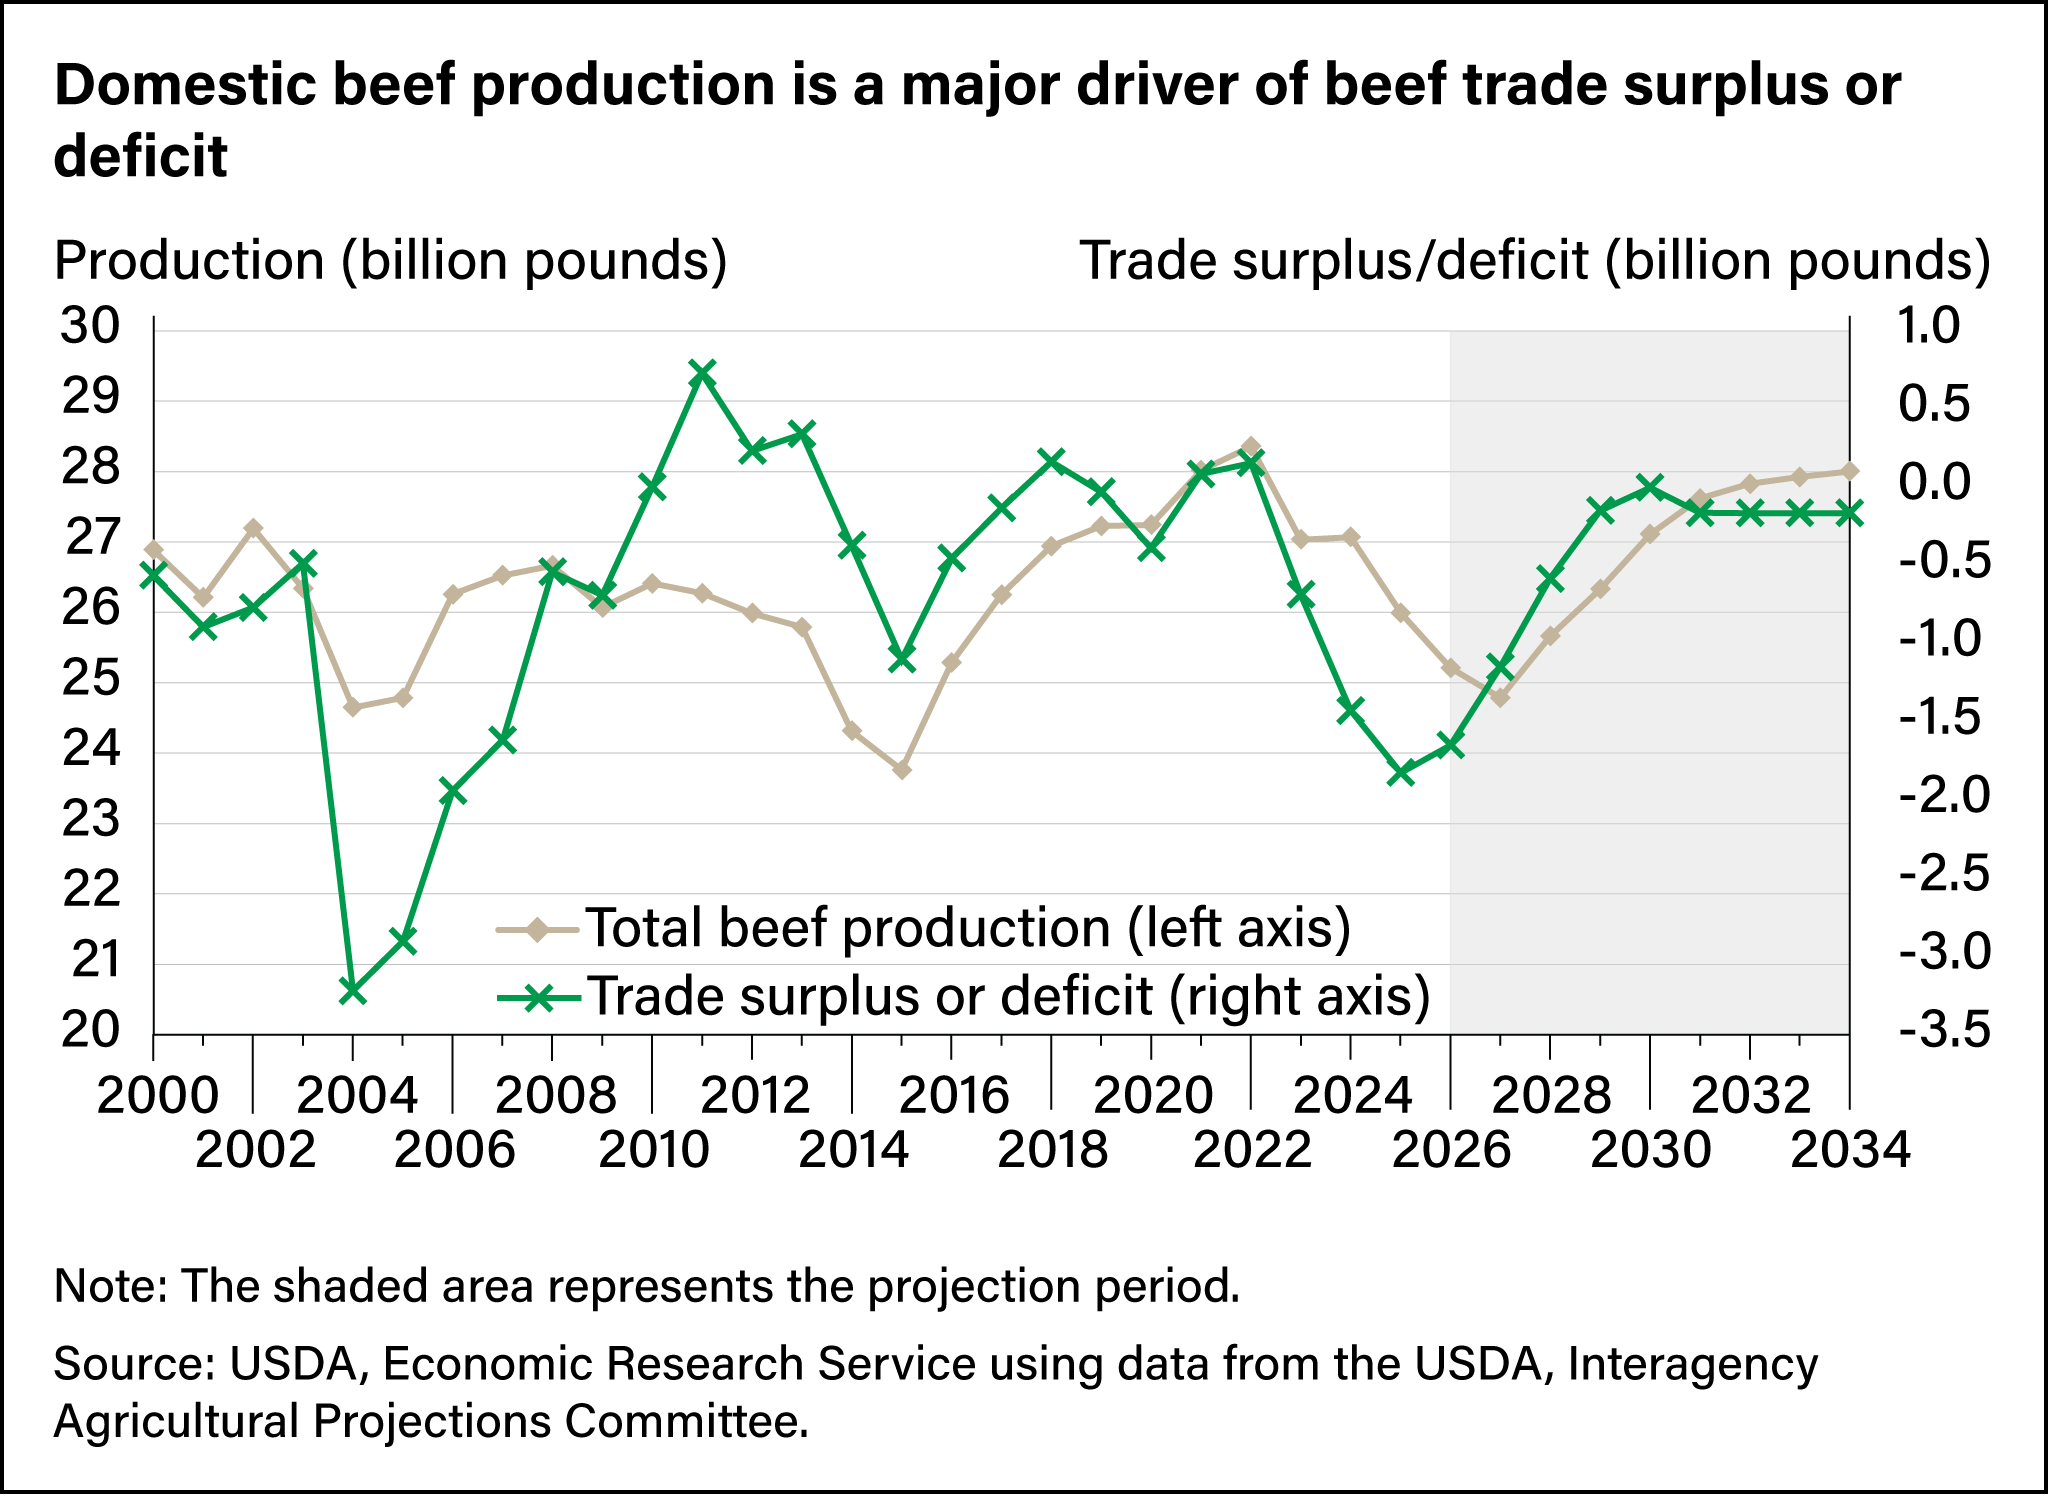
In 2025, the U.S. trade deficit for beef, calculated as the difference between export and import volumes, is projected at 1.8 billion pounds. This would be the largest deficit since 2006, when U.S. exports were still recovering from temporary trade restrictions against U.S. beef after a 2003 case of bovine spongiform encephalopathy was found in the U.S. cattle herd. As domestic production rises, the trade balance is expected to shift, with the deficit shrinking to nearly zero by 2030.
Pork Production Expected To Climb Through 2034
U.S. pork production cycles are less pronounced and more variable than in the past, when hog cycles—and the factors that drove them—more closely resembled those of the beef/cattle industry. Hog production cycles moderated partly because of changes in the pork industry structure that began in the late 1970s. Before the 1970s, the U.S. hog production industry was largely a secondary activity by Midwestern producers who operated farms with some cropland and a small number of sows. When corn prices were low, the farmers fed corn to the hogs instead of selling it. When corn prices rebounded, producers reduced sow breeding herds, marketed corn as grain, and waited for increased hog prices to result from reduced pork supplies. When the outlook for pork prices improved, small producers reentered the hog market—restarting the cycle—by increasing their sow herds and farrowings and eventually increasing the supply of hogs.
Post-1970s hog production is best described as a relatively small number of very large producers specialized in one segment of the hog production process. Large operations provide hog producers with scale economies, as a larger volume of hogs result in lower per-animal production costs. This factor plays an important role in moderating changes in hog cycles, breeding inventories, and pork production. It is also notable that post-1970s hog operations, in general, rely on more capital than those before 1970. Accordingly, variable costs make up a smaller proportion of total costs, so hog production can be less reactive to price changes for both hogs and inputs.
Commercial pork production is expected to continue growing steadily the next 10 years. Pork production is estimated to reach a record 28.5 billion pounds in 2025 and to grow 10 percent through 2034, reaching 32.6 million pounds as per-capita domestic consumption climbs. Live hog prices are projected to rise to $60.07 per hundredweight in 2026 and to $63.77 by 2028 before gradually declining to $50.14 by 2034.
A steady increase in U.S. pork exports is expected to follow the rise in domestic pork production. Pork exports are projected to grow from 7.4 billion pounds in 2025 to 9.5 billion pounds in 2034. At the same time, pork imports are projected to increase marginally, from 1.2 billion pounds in 2025 to 1.4 billion pounds in 2034. With export growth outpacing that of imports, the trade balance is expected to grow from a net surplus of 6.2 billion pounds of pork in 2025 to a net surplus of 8.1 billion pounds in 2034.
Broiler Chicken Production Expected To Continue Long-Term Growth Trend
The production cycle for broiler chickens is considerably shorter and less distinguishable than for cattle and pork. From hatch to slaughter, broiler chickens can be ready for production in 7 to 8 weeks. With more efficient feed conversion than cattle or swine, broiler production requires fewer feed resources than other sectors. Flocks also can be expanded more quickly, with parent stock needing only 4 to 5 months to begin laying eggs for hatching. Over the past several decades, broiler meat production has expanded as slaughter numbers and bird weights increased. Short generations, measured in months, help expedite genetic advances for broilers.
Over the next 10 years, broiler production is projected to reach record highs in each year, driven by strengthening domestic demand and favorable margins between feed costs and output prices. Unlike in the egg-laying sector, the effect on broiler chickens from highly pathogenic avian influenza has been minimal. The total loss of broilers in commercial production from 2022 through 2024 (10.4 million birds) was a fraction of a percent of total annual broiler slaughter. For broilers, heavier bird weights and increased slaughter numbers are expected to contribute to increasing production. Broiler chicken production for 2026 is projected at 47.9 billion pounds and is expected to grow to 53.4 billion pounds by 2034, an 11.5-percent increase. Despite rising production, national composite broiler chicken prices are expected to climb slowly over the next 10 years from $137.1 per hundredweight in 2026 to $145.4 by 2034.
U.S. poultry consumption is projected to rise from 103.6 pounds per person in 2026 to 110.4 pounds in 2034, and that increase is expected to account for most of the use of expanding chicken supplies. However, exports also are expected to grow throughout the projection period. Broiler exports are expected to grow from 7.0 billion pounds in 2026 to 7.7 billion pounds in 2034, an 11.5-percent increase. Imports made up less than 1 percent of the U.S. broiler supply in 2023 and are not reported in USDA’s Agricultural Baseline Projections.


