

Source: University of Georgia
Feeder calf grades are national standards that offer more consistent communication between the producer and other segments of the beef industry, such as stocker operations and feedlots. The terminology of the feeder cattle market can be vague and challenging to understand for both the novice and experienced cattlemen. The grading system is often not explained or conveyed clearly. Beef producers may be skeptical as to why their cattle or individual calves have sold for less money than others. Being informed on feeder cattle grading standards will help the beef cattle producer understand more about feeder calf pricing. Many variables equate to calf value. The U.S. Department of Agriculture Feeder Calf Grading standards can apply to cattle under 36 months of age.
Many of the factors listed are obvious at first glance. However, frame and muscling, in particular, are predictive variables as to how the calf will perform and grade once harvested at the packing plant. In other words, young, lightweight feeder cattle can be assigned grades and scores to estimate future carcass value. Carcass value is dependent upon the combination of quality grade and yield grade. This bulletin will address thriftiness, frame, muscling, flesh, and sex classification as it relates to grading feeder cattle.
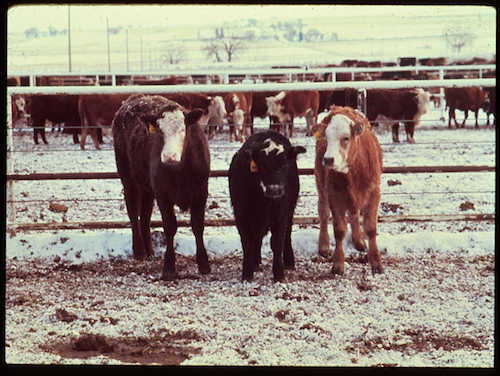
The three calves in Figure 1 were born on the same day. Although these calves are the same age, the number of days on feed in a feedlot may range by as much as 100 days or more to achieve a similar carcass endpoint. Feeder calf grading improves the industry’s ability to better group cattle into more uniform groups for more efficient feeding and management. Feeder cattle grades can also convey whether cattle are outside ideal parameters. If growth potential for an individual calf or group of calves is expected to be low, buyers will discriminate. Conversely, if the animal must be fed to a weight endpoint outside of industry acceptability to achieve ideal carcass merit, potential buyers will also discriminate.
Figure 1. Variation in Feeder Calves.
| Size | Steer (lb) | Heifer (lb) |
|---|---|---|
| Large | 1250 or greater | 1150 or greater |
| Medium | 1100 to 1249 | 1000 to 1149 |
| Small | Less than 1100 | Less than 1000 |
Thriftiness
Feeder cattle must be deemed “thrifty” in order to receive frame and muscle scores. “Thrifty” is a term used to describe cattle that can grow and develop normally according to beef industry expectations for growth and marbling. Unthrifty cattle are either unhealthy or genetically unfit for optimum growth and development of marbling. Examples of unthrifty cattle are those with double muscling, severe emaciation, or a leg injury that would prevent proper weight gain. Neither example would fit the USDA frame score standards. Cattle that are determined to be unthrifty are graded U.S. Inferior. If a calf completely recovers from a disease or injury, the calf can be graded at that time.
Frame Score
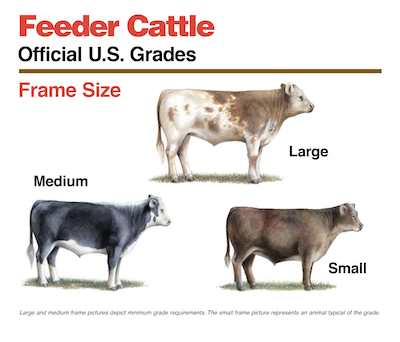
The USDA feeder cattle frame scores are “small” (S), “medium” (M), and “large” (L), as seen in Figure 2. Larger-framed cattle generally have a higher rate of gain, require more time on feed to reach the same finish or fatness, and will attain a heavier slaughter weight. Depending upon feed prices and cattle supply, the demand for larger frame cattle can vary slightly, but typically, upper-medium to lower-large framed cattle have reaped the highest prices compared to lower-medium and smaller-framed cattle. The key to understanding how frame-scoring works is to understand what frame scores ultimately predict. Frame scores predict the potential weight range (Table 2) of a given steer or heifer when it has reached its compositional endpoint of around 0.5 inches of external fat and potentially grade “low choice” or higher. Thus, a frame score can help communicate the potential endpoint value differences that exist between each calf for the buyer and seller. It should be noted that over the past two decades, there has been an increase in average carcass weight of over 100 lb This is a reflection of feeding larger framed cattle in addition to growth implant strategies.
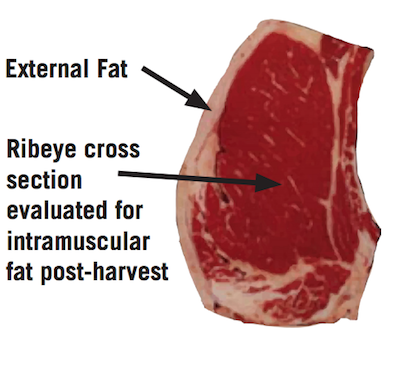
Cattle graded as “large framed” are expected to weigh over 1250 lb when their external fat is approximately 0.5 inches at the 12th rib. This is the location where beef carcasses are “ribbed” to expose the ribeye cross section for grading purposes (Figure 3). The 0.5-inch target is used in the USDA standards as a reasonable live animal predictor of a calf’s ability to grade “low choice” or higher.
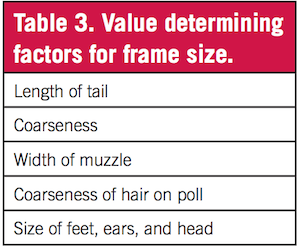
Cattle buyers or graders evaluating 500-lb feeder calves are estimating the growth indicators that help predict final endpoint weight. Buyers and graders use a combination of the criteria in Table 3.
For example, a feeder calf with a long, coarse tail, large head, and wide muzzle weighing 500 lb is older, or earlier maturing, and will have less genetic ability for gain compared to a 500-lb calf that is longbodied, short-tailed, and fine-haired. The more youthful-appearing calf should have more growth potential and ultimately have a higher yielding carcass with less trimmable waste. Although yield is important, large-framed cattle tend to have less genetic potential for marbling compared to smaller-framed cattle. A finished steer or heifer that has both an acceptable yield grade and a desirable quality grade is a difficult balance. However, genetic selection for marbling in purebred herds has made this more achievable and has improved the industry’s percentage of cattle grading “low choice” or better.
Small-framed cattle will generally receive much lower prices throughout the beef chain and produce poorer yielding carcasses with more trimmable fat. Today’s industry severely discounts lightweight carcasses (under 600 lb). Excessively finished carcasses with yield grades of 4 and 5 also receive heavy discounts.
Muscle Scoring Feeder Cattle
USDA feeder cattle muscle scores (MS) are either “1,” “2,” “3,” or “4” based on subjective assessment of a trained grader (Figure 4). They are used as common terminology within the industry to communicate differences in muscle. Muscle scores with a lower numerical value indicate greater amounts of muscling. Feeder cattle with a muscle score of 1 are highly marketable cattle that are expected to have carcasses with a larger ribeye, less fat and consequently a more desirable yield grade (U.S. Yield Grade 1 or 2).
Figure 4. USDA feeder cattle muscling scores.
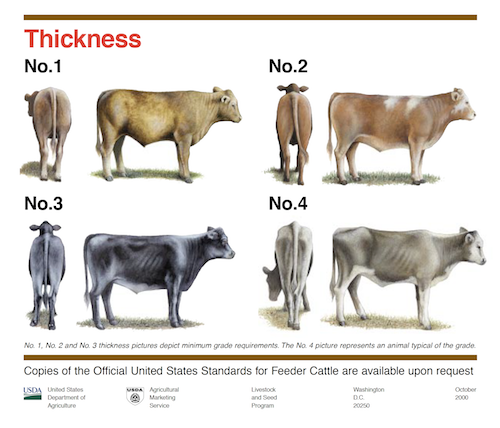
Muscle thickness refers to the development of the muscle system. USDA feeder grade standards describe “MS 1” as moderately thick and comprised predominantly of beef breeding. An “MS 2” is described as slightly thick with a high proportion of beef breeding. An “MS 3” is described as thin throughout with the legs close together. The “MS 4” score was added in the standards revision of 2000. An MS 4 is described as having less thickness than an MS 3. Cattle receiving an MS 3 or 4 would have a dairy type appearance. An MS 4 is not common.
Muscle has a rounded shape when in abundance (No. 1, or MS 1, in Figure 4). Jorgenson’s Muscling Theory is a good way to help visualize the ideal muscling of an MS 1 or upper MS 2. This concept is often used by USDA graders to teach muscle scoring. Cattle that look more circular from a rear view exhibit greater muscling. By comparison, cattle that are lightly muscled more closely resemble an inverted triangle (Figure 5).
Cattle receiving a MS 1 or upper MS 2 more optimally meet industry standards for yield grade. Yield grades are used to group carcasses according to the expected amount of boneless, closely-trimmed retail cuts. Cattle with less muscling in the hip and hindquarter will typically yield a smaller ribeye and deposit fat more quickly. Carcasses with below-average muscling are subject to receive poor yield grades (U.S. Yield Grade 4 or 5) that receive discounts on a grid-pricing system.
Figure 5. Jorgenson Muscling Theory;
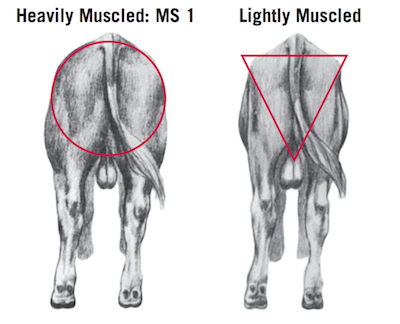
Figure 6. Jorgenson’s Muscling Theory on calves with excessive flesh.
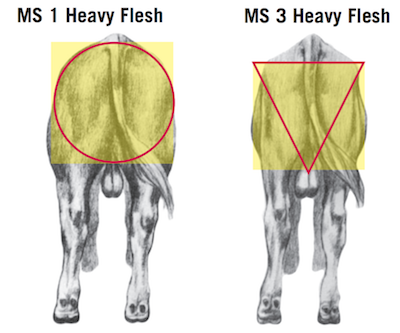
Flesh Flesh score (FS) will also influence feeder calf value. USDA uses the term “flesh” to describe differences in external fat. However, it is not a part of USDA grade standards, as it can change over time and is more dependent on nutritional environment. Calves with excessive flesh within a given frame and muscle score will typically have a lower sale price. These cattle are heavier than ideal at a given weight with less opportunity for additional gain in the next phase of the beef chain. Figure 5 displays the visual effect of additional fat deposition on feeder cattle for both heavy and light muscled cattle. Heavily muscled calves with excessive flesh appear less circular and exhibit a square-like shape at a rear view. An MS 1 feeder calf with excessive flesh will appear to have a less rounded shape due to the fat deposits that develop in the upper hip and lower quarter. Likewise, lightly muscled cattle with excessive flesh will also be squarer upon the rear view.
USDA Feeder Cattle Standards do have a scale for flesh that ranges from 1 to 9. Flesh scores are much like the body condition scoring scale for mature cows. Neither excessively thin (FS 1, FS 2) or fleshy cattle (FS 6 through FS 9) are ideal from a marketing perspective. Overly thin calves will have three or more ribs that can be easily seen. Overly thin cattle are discounted for their lack of gain potential whether genetic or due to previous management. Thrifty calves with a flesh score of 3, 4, or 5 offer more gain-profiting potential in many traditional marketing venues. Thus, flesh scores should be a consideration for cow/calf producers when making decisions about creep feeding or preconditioning programs. Calves may become too fleshy and negate any additional weight gain due to creep feeding, particularly for medium- and small-framed feeder calves. Refer to UGA Extension Bulletin 1315, “Creep Feeding Beef Calves,” for more information.
Sex Classification
When grading feeder calves it is also necessary to understand the differences among heifer, bull, and steer calves. Male cattle tend to grow and stay leaner for a longer period of time considering that all other factors are equal. This explains that steers and bulls bring a premium when compared to heifer calves. It should also be noted that steers (castrated males) will bring a premium compared to bulls (intact males) if all other variables are constant. Steers bring a premium versus bulls, as they are already prepared for the remainder of the commercial beef chain. Bull calves will have to be castrated before entering the feedlot segment. Castration prior to the time of marketing has long-term benefits for health and performance.
| Feeder Sex Class | Weight (lb) | Price per Hundred |
|---|---|---|
| Heifer (Med & Lrg 1) | 500-545 | $107-114 |
| Bull (Med & Lrg 1) | 500-545 | $112-120 |
| Steer (Med & Lrg 1) | 500-545 | $125-129 |
Research confirms that bulls will have diminished gains and increased sickness due to the stress of castration (Massey et al., 2011). Stocker operators may choose to purchase feeder bulls. They are assuming the risk and capturing the value of marketing healthy feeder steers at heavier weights. Table 4 shows the price differences reported by a USDA Market News summary of five weekly auction sales across Georgia during September 2016. Table 4 demonstrates the value difference that exist in bulls verses steers. Prices reported at this time show that steers were valued as much as $5 more per head in comparison to their steer counterparts.
Summary
Feeder cattle buyers, marketers, and producers are able to better communicate the growth and carcass merit potential of individual and grouped calves using the USDA Feeder Cattle Grading Standards. Producers that are aware of these standards and their use in predicting carcass value are better suited to making breeding and management decisions to improve the value of future calf crops. Feeder calf grades can be used within individual herds to provide insight for herd sire selection. Appropriate sire selection can quickly reduce the number of small-framed or MS 2 or 3 calves in a producer’s calf crop. For more information on feeder cattle grading, contact your local Extension office at 1-800-ASK-UGA-1.
References
Agricultural Marketing Service. (2000). United States standards for grades of feeder cattle. U.S. Department of Agriculture. https://www.ams.usda.gov/sites/default/files/media/Feeder_Cattle_Standard%5B1%5D.pdf
Agricultural Marketing Service. USDA market news. U.S. Department of Agriculture. https://www.ams.usda.gov/market-news
Massey, C., Dhuyvetter, K. C., Llewelyn, R. V., & Blasi, D. A. (2011). Castration and morbidity and their effects on performance, carcass quality, and price differentials for bulls and steers. Prof. Anim. Sci., 27(1), 19–28. https://doi.org/10.15232/S1080-7446(15)30440-X
Stewart, L. (2017). Creep feeding beef calves (Publication No. B 1315). UGA Cooperative Extension. http://extension.uga.edu/publications/detail.html?number=B1315


