Source: FCC
As we start the new year amid new challenges, including slowing population growth and potential trade barriers, here are our top charts to help make sense of the economic environment for the agriculture and agri-food sector, from producers to consumers.
Slower population growth will dent economic growth
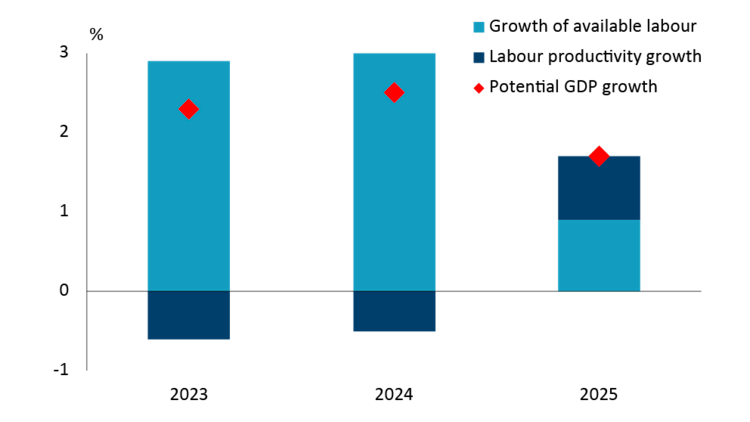
After a rough couple of years, when real GDP growth averaged a meagre 1.5%, Canada’s economy is unlikely to get much better this year. Reduced immigration levels are expected to slow population growth, significantly reducing potential GDP growth – the economy’s speed limit, which is estimated as the sum of available labour (i.e., population) growth and productivity growth.
The Bank of Canada currently estimates potential growth to be just 1.7% in 2025, but even that seems optimistic given the central bank’s expectation of productivity bouncing back significantly this year (Figure 1). It’s unclear what will rekindle productivity, more so considering business investment has been treading water. With such a low speed limit, don’t count on Canada’s real GDP growth to bounce back significantly in 2025.
Figure 1: Economy’s speed limit has been lowered for 2025
Source: Bank of Canada
Tariffs, Trade, and the Canadian dollar
As if slowing population growth wasn’t enough, Canada also has to contend with a more uncertain trade environment. With Donald Trump’s return as U.S. President, Canada is facing the prospect of punitive tariffs and a resulting slump in exports. Look for U.S. tariffs, if any, to be imposed for a few months on selected products as a negotiating tactic, as was the case in 2018, before being lifted. If 2018 is any guide, cool heads will prevail in the end because negotiators know all too well how interconnected the two economies are. We expect both parties to eventually agree on a deal, which will provide a framework for CUSMA 2.0. But any tariff drama will be enough to restrain exports temporarily and depress investment, further restraining real GDP growth this year.
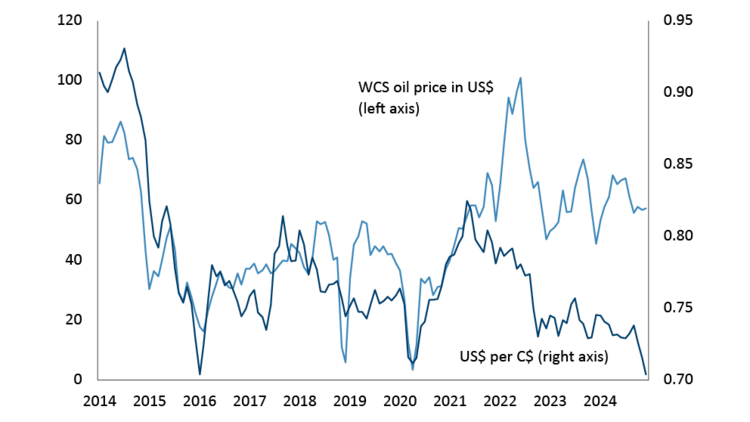
With such a cloudy economic outlook, it’s difficult to be optimistic about the Canadian dollar. While the underperforming loonie helps to boost Canada’s export dependent economy, imports or any trips to the U.S. will cost a lot more. The loonie’s correlation with oil has broken down over the last three years (Figure 2). But only part of that breakdown is due to Canada-U.S. interest rate differentials. In fact, the differential is similar to what it was in early 2007, and the WCS oil price is much higher than 18 years ago. And yet the C$ is now trading at just 70 U.S. cents or so, versus 90 cents back in 2007. Clearly there’s more to the ailing loonie than just oil and the interest rate spreads. That casts doubts about the likelihood of a significant rebound for the loonie this year.
Figure 2: Loonie’s correlation with oil has diminished over the past three years
Sources: Bank of Canada, Government of Alberta
Weathering the upcoming Canola trade barriers
Uncertainty hangs over the 2025 canola market due to China’s anti-dumping investigation but also a smaller than anticipated Canadian canola crop. It will take time for China to conclude their investigation – China’s 2018 case against Australian barley took 18 months – but in the meantime since the beginning of the crop year on August 1st, Canadian canola exports have been strong. Thanks to China accounting for over 75% of all shipments, the export pace is running 10 weeks ahead of schedule. Even if China slows down as expected, Canada will only need to export another 3 million tonnes of canola to reach Agriculture and Agri-Food Canada’s (AAFC’s) export target of 7.5 million tonnes in 2024/25. China’s anti-dumping probe is more likely to impact 2025/26 exports.
Canada’s 2024 canola crop of just under 18 million tonnes has been in demand by domestic processors in addition to the strong export pace. The canola crush sector is on track to process over 11.5 million tonnes this crop year. If exports slow more than anticipated, crushers could process closer to 12 million tonnes, but it would depend on farmer deliveries. The other factor to consider is demand for canola oil, which is currently price competitive compared to other vegetable oils including soybean oil. Canola oil has found a home in U.S. biofuel programs to date but uncertainty surrounding the specifics of U.S. biofuel and government policies for 2025 leaves this market in limbo right now.
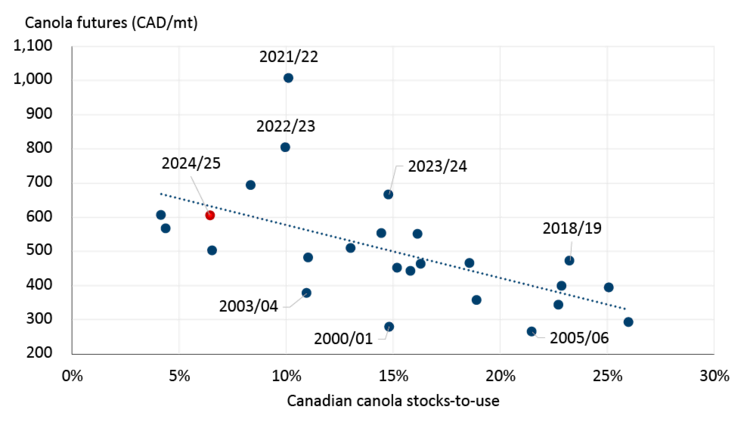
Overall, the impact on the remainder of 2024/25 canola marketings will depend on how U.S. biofuel policies change and any U.S. import tariffs, but these are balanced by the smaller crop size. Current stocks-to-use estimates are anticipated to be tight but are priced appropriately relative to the long-term trend (Figure 3). The upcoming 2025/26 crop will likely be influenced more by China’s anti-dumping probe and 2025 weather. Reduced exports to China in 2025/26 could result in increased ending stocks if alternative export destinations don’t materialize. Prices would decline based upon the corresponding stocks-to-use trend.
Figure 3: Exports and domestic crush will influence canola stocks-to-use and prices
Sources: Barchart, USDA, FCC calculations
Concern building for hog producers regarding voluntary country of origin labeling (vCool)
Starting in 2026, for meat to qualify for a “Product of USA” label, the animal must be born, raised, and processed within the United States. While the rule doesn’t come into force until next year, U.S. processors could begin implementing it later this year. This rule is voluntary, allowing companies to opt-out of labeling their products if they prefer. This change is intended to circumvent the previous mandatory country-of-origin labeling (mCOOL) regulations, which were repealed following Canada and Mexico’s victory at the World Trade Organization. We discussed this development last fall.
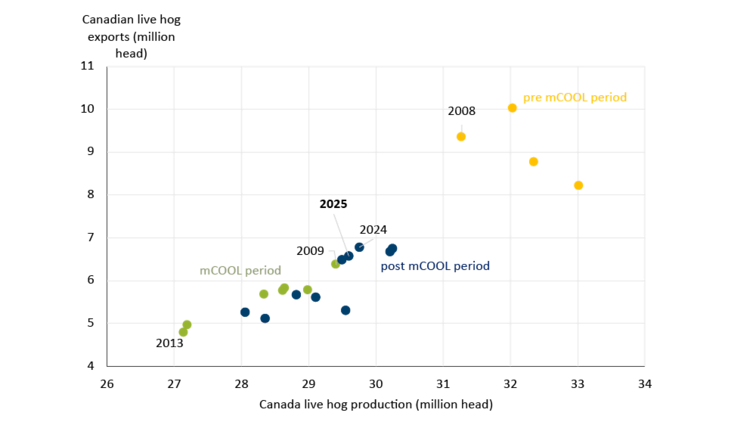
Canadian hog production growth is closely linked to exports of live animals, including 21-day old piglets to market-ready hogs, with most of these exports going to the U.S. Before mCOOL was implemented in 2009, Canada produced approximately 32 million hogs annually and exported 8-10 million hogs (Figure 4). However, by the midpoint of mCOOL in 2013, production had decreased by 5 million hogs and exports declined accordingly. Production has never recovered to pre mCOOL levels, and with Canada’s domestic slaughter capacity facing various challenges in recent years, any disruption in export demand could result in a smaller Canadian hog herd in the upcoming years as hog prices would be pressured to clear the excess supply.
Figure 4: Canadian hog production is tightly connected to live hog exports
Source: USDA PSD
High cow and heifer slaughter rates not conducive to herd rebuilding
The Canadian beef herd hit its lowest point in 30 years last year and when data is released for January 1, 2025, it is expected to be smaller once more, despite another year of excellent to record cattle prices. In 2024, nearly half of the slaughtered cattle in Canada and the U.S. were heifers and cows, a 3-year low but still historically high, which will result in the herd declining to start 2025 (Figure 5). To see the herd start to grow in a year, the industry needs cows and heifers to make up less than 47% of slaughter. Until that happens cattle prices will remain near record levels, which will undoubtably support retail beef prices. Don’t expect bar-b-q season to be a cheap one given Canadian’s preference for beef means demand is expected to remain strong.
Cow-calf producers have benefited from high prices, some using the extra income to pay off debt from drought years, while others chose to leave the industry rather than expand their herds. Cow-calf profitability is expected to remain strong in 2025 and while herd rebuilding might start later this year, significant expansion won’t be seen for a few years. Rebuilding the herd will take several years of good weather and high prices. Fortunately, feed supplies improved last year.
While supply and demand fundamentals suggest a positive outlook for cattle prices, potential trade issues are a major concern. Tariff threats from the new U.S. administration could impact the Canadian-U.S. livestock sector due to the integrated North American market. The uncertainty around tariffs and vCOOL may also hinder Canada’s ability to retain heifers for herd growth.
Figure 5: Declining slaughter rates still not supportive of Canada and U.S. herd rebuilding as of January 1

Sources: Statistics Canada, USDA, FCC calculations
The cow-calf sector is not the only one reaping the benefits of high cattle prices. The Canadian dairy sector has also benefited. The milk per cow productivity gains has allowed the dairy sector to cull additional cows and send more calves to slaughter increasing dairy revenue.
Does the blended milk price have the potential to move in 2025?
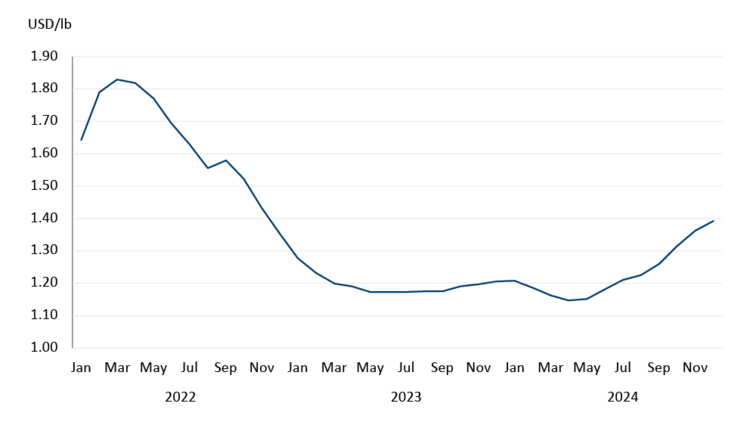
In November 2024, the Canadian Dairy Commission (CDC) announced there will be a very slight decline (-0.02%) in the farmgate milk price in 2025. However, not all of the average blended price is set within the supply management system. Approximately 11% of butterfat (by weight) goes into Class 5 products, a class of milk where all components are determined by U.S. prices (solids non-fat prices in some Class 4 products are also determined by U.S. prices). The price of non-fat dry milk began to rise in the latter half of 2024 (Figure 6), providing a small boost to Canadian average blended prices in the process.
The USDA is projecting non-fat dry milk prices in the U.S. to average $1.30/lb in 2025, which if it held, would be a 5.4% increase from 2024. This price, however, is subject to market forces and could move up or down as the year unfolds. Our analysis shows that a 10% swing in Class III milk prices changes the average blended milk price by 0.5%, all else being equal. So, if producers are hoping for a price boost in 2025, it’ll have to come from a rise in U.S. milk prices.
Figure 6: U.S. non-fat dry milk prices rose towards the end of 2024
Sources: Barchart, FCC calculations
Food processing: Who’s the most vulnerable to trade barriers?
After a year of roughly flat sales, food and beverage processors are facing the prospect of another difficult year in 2025. Several sectors are highly reliant on exports and are therefore vulnerable to increased trade protectionism.
The United States is the largest single market for exported food from Canada, accounting for 30% of food processing and 10% of beverage processing sales. Its economic size, proximity, and cultural similarities make it hard to overlook as an ideal destination for Canadian businesses. However, low diversification puts the sector at risk. Tariffs proposed by incoming President Trump, would increase the prices of Canadian products compared to U.S. and put financial pressure on sectors highly reliant on exports to the U.S. The sugar and confectionery sector is particularly vulnerable given that more than 80% of its sales are generated from exports to the U.S. (Figure 7).
For those businesses selling primarily to the domestic market, there is still reason to be aware of potential trade wars impacting imported ingredients and the depreciating Canadian dollar.
Figure 7: Reliance on United States export market varies across sub-sector
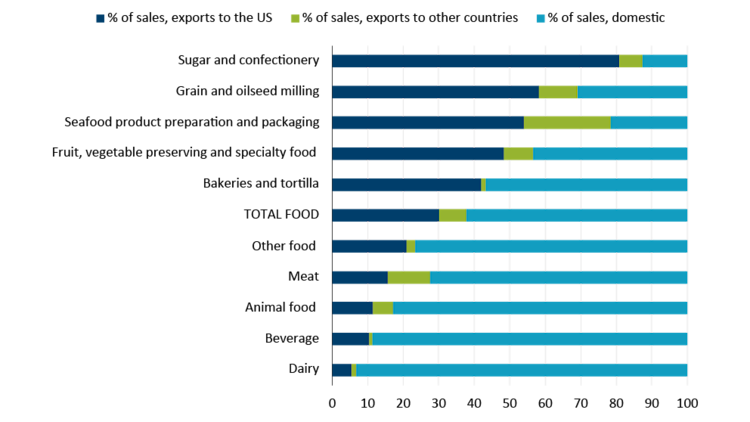
Note: 2024 YTD January – October
Sources: Statistics Canada and FCC calculations
Rising costs will cap farm equipment sales
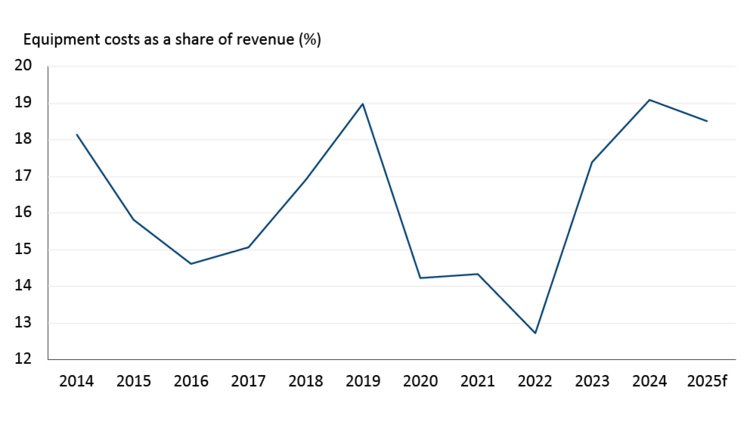
Over the last two years new equipment costs per acre have risen faster than farm revenue per acre, so much so that equipment costs as a share of farm revenues have soared to a decade high (Figure 8). So, it’s not surprising that sales of farm equipment have been weak.
Figure 8: Farm equipment still expensive relative to revenue
Source: FCC Economics
New farm equipment unit sales are projected to remain soft through 2025 as farmers feel the pressure of lower commodity prices, high equipment prices, and tighter profitability. However, the decline in sales is expected to be less severe than in 2024, and sales of 4WD tractors should stay above the five-year average. This trend is not just in Canada; U.S. farmers are facing the same issue. Because of weak demand, U.S. farm equipment manufacturers have cut production.
This weak demand has also affected the used equipment market, leading to higher inventories. Last year, some dealers sold excess inventory at auctions for lower prices. We expect this trend to continue in 2025, with more used equipment being sold at auctions. However, new equipment prices might not come down all that much because they are mostly set in U.S. dollars and with the forecast of weak loonie through the year this would pressure prices higher. Furthermore, if tariffs are added, prices of new equipment would increase further.
Overall, we expect overall equipment costs to better align with farm revenue than over the past two years.
Leigh Anderson, Senior Economist
Graeme Crosbie, Senior Economist
Amanda Norris, Senior Economist
Justin Shepherd, Senior Economist


